




 VIP会员


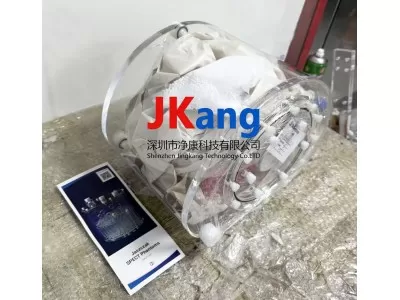
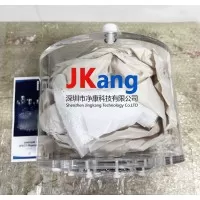
Like jaszczak phantom, it has cold rods and solid spheres. But the lid is different. It has many cylindrical cavities of different sizes that can be filled separately. These activities can be filled with air, water or higher concentrations. And there's a solid ptfe cylinder。

Jaszczak model, esser pt performance model, not blue esser pt modelMain applications
• detectability assessment of tumours
• suv assessment
• receiving and inspection tests
• conventional quality assurance and control
• declining and dispersive correction assessment
• research
• acr recommended model - acr order petap or nmap number must be provided
Gas tank:
Tank inner diameter: ~ 209 mm
Air tank height: ~ 186 mm
Tank wall thickness: ~6. 4 mm
Plugin:
Bar diameter: 4. 8, 6. 4, 7. 9, 9. 5, 11. 1 and 12. 7
Mm*
Bar height: 8. 8 cm
Solid ball diameter: 9. 5, 12. 7, 15. 9, 19. 1, 25. 4 and
31. 8 mm
Distance of sphere centre to installation surface: ~ 127 mm
Jaszczak module
(1) model structure:
The jaszczak module has multiple models that can be used for performance assessments such as spect or pet imaging system resolution, image quality, quantitative performance, etc. The internal plug-ins are numerous and are commonly composed of six cold rod sectors with different diameters and six solid balls with different diameters. The cold rods can be replaced with hot stove plugs and the solid sphere can be replaced with hollow balls. Different plugins may be selected depending on the device resolution, with a minimum diameter of 3. 20 mm for the cold rod and 5. 94 mm for the sphere. Esser model (figure 1b) is one of the jaszczak model variants, the main difference being that the esser model lid connects to fillable cylinder cavities of varying sizes that can be used in pet system performance assessment, acceptance testing, etc. [5]。
(2) performance indicators:
Different performance indicators are available for different models of jaszczak. The commonly used indicators are standard intake values (standard uptake value, suv), target base margin values (target-to-background ratio, tbr), contrast-to-noise ratio, cnr, signal-to-noise radio, snr) and observer ratings. Suv is a semi-quantifiable parameter commonly used in pet, allowing a quantitative description of radioconcentration in pet images, and has some reference value in the diagnosis of disease identification and in the monitoring and evaluation of therapeutic effects.[ 28-29]; suv measurements are influenced by multiple biological and technical factors, with different suvs obtained by different roi sketching methods [30]. Tbr, the ratio of average pixels to average background pixels for the target area above the image, is a relative quantitative indicator of the intensity of uptake of the radiotonic tracer in the cookstove, the mapping of the target area and background roi can have a significant impact on tbr accuracy, and equipment performance and imaging conditions can affect tbr values [28-29]. Both snr and cnr can be used to measure image quality. Cnr is the ratio of the disease stove to the background to the noise in the background. 31], for measuring the visibility of areas of interest in reconstructing images, the detection capacity and image quality of quantitative assessment equipment [17]; the greater the cnr, the better the visibility of the object relative to the background, when the target cnr > 5 is detectable according to the rose standard [32]. Snr is the true ratio of signal to noise, which can be defined in a variety of ways by quantifying different signals to noise [33]. Differences between snr and cnr formulas used in different studies [23, 27, 31]. The observers rate as being part of the study of human observers, who rate the target according to subjective impressions and ultimately judge whether the pathology can be detected according to the score criteria. Common assessment methods are three and five [16]. The human observer assessment and cnr measured the detection capacity of the equipment in qualitative and quantitative terms, respectively [17]。
(3) use:
Compared to the nema nu2 module, the jaszczak module provides a smaller size of hot stoves, and thus allows an assessment of the imaging system's small-scale stove detection capability. Oddstig et al. [34] used the nema nu2 module to compare the image quality and detection capabilities of the same plant's traditional pet with digital pet, and to explore the advantages of sipm by maintaining consistency between all scanning and reconstruction parameters. The results showed that the images collected by sipm pet had a slightly higher tbr, but did not show a significant difference with traditional pet in the detection capacity of small cookstoves, considering that the use of a detector based on sipm was not a major factor in the improvement in the quality of digital pet images, and that the improvements brought about by sipm were more pronounced in terms of useful life and time resolution. Although the jaszczak module can provide smaller heat stove sizes, the recovery coefficient curve cannot be mapped to provide a repeatable recovery coefficient because the small ball diameter used in the study is too small to be seriously affected by pve, and therefore the module plugin is selected to the extent appropriate。
With the development of spect/ct, image reconstruction algorithms and photon decay, compton dispersion and resolution compensation methods, standard intake values (standard uptake value, suv) initially used for pet quantitative measurements could also be used for spect imaging [35]. Halim et al.[36] used the jaszczak module to assess the quantitative accuracy of different types of suv indicators at different activity concentrations, different heat stove background activity ratios and different reconstruction parameters using 99 tcm spect/ct. The results show significant differences between suvmean and the other three indicators in all the groups, with suvmean underestimating the real value of suv and suvmax showing overestimation. The suv values obtained at low activity concentrations were the closest to the theoretical values from the 2 ergonomics, 10 subsets and no back-filtration reconstruction. 4 mm goss filters have drastically reduced the accuracy of suvs, possibly because they remove noise while reducing the number of reconstructed images. It is therefore recommended that, in clinical spect/ct work, reconstruction parameters and filters must be reasonably selected to balance image quality and noise to ensure quantitative accuracy, considering the use of suvmax, which is more accurate at various activity concentrations under tbr, but 18f-fdg pet studies at mansor and others [23] show that suvmax is more affected by changes in location and reduces the quantitative accuracy of vertical comparisons of the same patient, and recommends that a quantitative analysis be conducted using suvpeak instead of suvmax. Suvpeak is the average of suv in voipeak, which includes the most active part of tumour metabolism and is fixed in size, and 1 cm 3 sphere is recommended as the standard definition for suvpeak in the pet evaluation criteria for real tumours.[37] studies have shown better consistency between suvpeak under different tbrs and suvpeak under 18f-fdgs time