

Kdj is..Futures tradingThe swing-type technical indicators commonly used are essentially a sign of over-buying and short-term trends through rapid and slow price fluctuations. In volatile and fast-paced futures markets, mastery of kdj indicators can help traders to better judge the timing of entry and exit sites and reduce perceived errors. Today, the young editor made clear the practical use of kdj indicators in futures transactions and helped you to use this trade tool。
I. What exactly is the kdj indicator
Kdj, also known as random indicators, was first created in the futures market by george ryan in the late 1950s. Its core logic is that when prices rise, the closing price tends to be closer to the top price of the day; when prices fall, the closing price tends to be closer to the lowest price of the day. By calculating the true wavelength of price volatility, the market's over-sale status and momentum are reflected。
A complete kdj consists of three lines:
-k-line: fast random value, medium reaction speed
-d-line: slow-speed random values, slowest reaction, smoother and stable
-j-line: reflects the degree of deviation between k and d, the highest sensitivity, and the only line that can break through between 0 and 100
The response speed of the three lines is in the order of j'k'd. The default parameters are usually set (9,3, 3), the most common combination in the market, suitable for most varieties and cycles。
Ii. Understanding three regions, first understanding space patterns
Kdj values fluctuate between 0 and 100 (j values can be exceeded) and the whole number axis can be divided into three key areas:
More than 80: superbuying areas
When all three kdj lines operate above 80, this means that the market is overheated in the short term, that multiple forces are overexhausted and that there may be a reversal at any time. It is a high-risk position to pursue, but rather to guard against downside risks。
Less than 20: superseller area
Kdj fell below 20, meaning that short-term outages were over-released, markets were oversold and prices were prone to rebounding. The region is the focus of observation for low-suction opportunities。
Between 20 and 80: multi-empty balance area
This is the normal operating range of the indicator. The 50-axis is a strong and weak watershed - kdj operates over 50, multi-heading; 50-down, empty-heading. A simple round-trip around 50 indicates that the flow is in the process of convulsion and that the value of the signal reference is limited。
Iii. Why don't you use the gold fork instead of the pit
The gold fork and the dead fork are kdj's most widely known signals, but many people don't use them well, and the problem is, "whatever."。
1. Two qualities of gold fork
Low-level gold fork (near 20 and below): k-line cuts the d-line from the bottom up and crosses near the supermarket area. This is the highest-quality buy-in signal, with a strong inverting force and a large subsequent rise in space, and is the ideal time for low entry。
Medium gold fork (near 50): crossing point above and below the 50 axis, signal strength is generally short-line, often only rebounding, suitable for fast-in-out and back-in。
Two qualities of a dead fork
High-level fork (near 80 and above): k-line drops up and breaks the d-line, and occurs in over-buying areas. This is an empty signal of high reliability, indicating that short-term lifting energy is depleted and that adjustment is highly probable。
The low fork (below 50): the presence of a dead fork in a vulnerable area represents a continuation of the empty trend, and it is important not to copy too much in this position, which is easy to copy on half the hill。
3. An important principle: to be strong, to be small
Kdj is essentially a shock indicator, and is the most likely to appear in the crosswalk: the price of the gold fork went down as soon as it was empty。
The solution is simple: to set a general trend and then to use kdj to find entry points. In the upward trend, only a low-level gold fork is done, with no sign of dead fork; in the downward trend, only an empty fork is done with no sign of high-level fork. This will filter out most of the ineffective signals, and the odds will increase significantly。
Iv. Progress use in federation
1. Parameters are not static
The default (9,3, 3) is appropriate for most scenarios, but can be adjusted flexibly for different cycles:
- daytime shorts: can be tried (6, 3, 3) more responsive and capture faster fluctuations
- band transactions: available (14,3, 3), filtering of tatters, more stable signals
- different varieties have different volatility rates
2. Combining mcd, a classic set
"macd's trend, kdj's looking for a spot" is a real tactic for many old traders. Macd determines the direction and intensity of the trend, kdj is responsible for the precise timing of entry and exit, and signal reliability increases significantly when the two indicators resonate。
For example, mad runs multiple trends above the 0-axis, while kdj forms gold fork around 20, which is a very good chance of doing more; on the other hand, mcd is below the 0-axis and kdj is dead near 80, which is a high-winner space。
3. Alert against passivation
When a unilateral surge or collapse occurs, kdj will remain in the over-purchase or over-sale zone for long periods of time, at which time the over-solding will be counterproductive. In the face of unilateral situations, kdj's weight has to be reduced, and greater reliance has to be placed on average and trend-type indicators to determine direction。
How do ordinary traders use kdj indicators
Futures are changing rapidly, kdj signals are passing, and a good device can help you catch the opportunity in time, with fewer turns. It is recommended that the app be calibrated, and its kdj indicator function is useful and suitable for ordinary traders。
Opens up an app, opens any futures, clicks on "indicators" in the k-line interface, folds kdj with one key, and defaults are standard parameters that are common to the industry, and starters can use without making themselves available. From 1 minute, 5 minutes to the dayline, weeklines, multiple cycles of free trade, you can find the corresponding kdj signal, whether you make short-line or band deals。
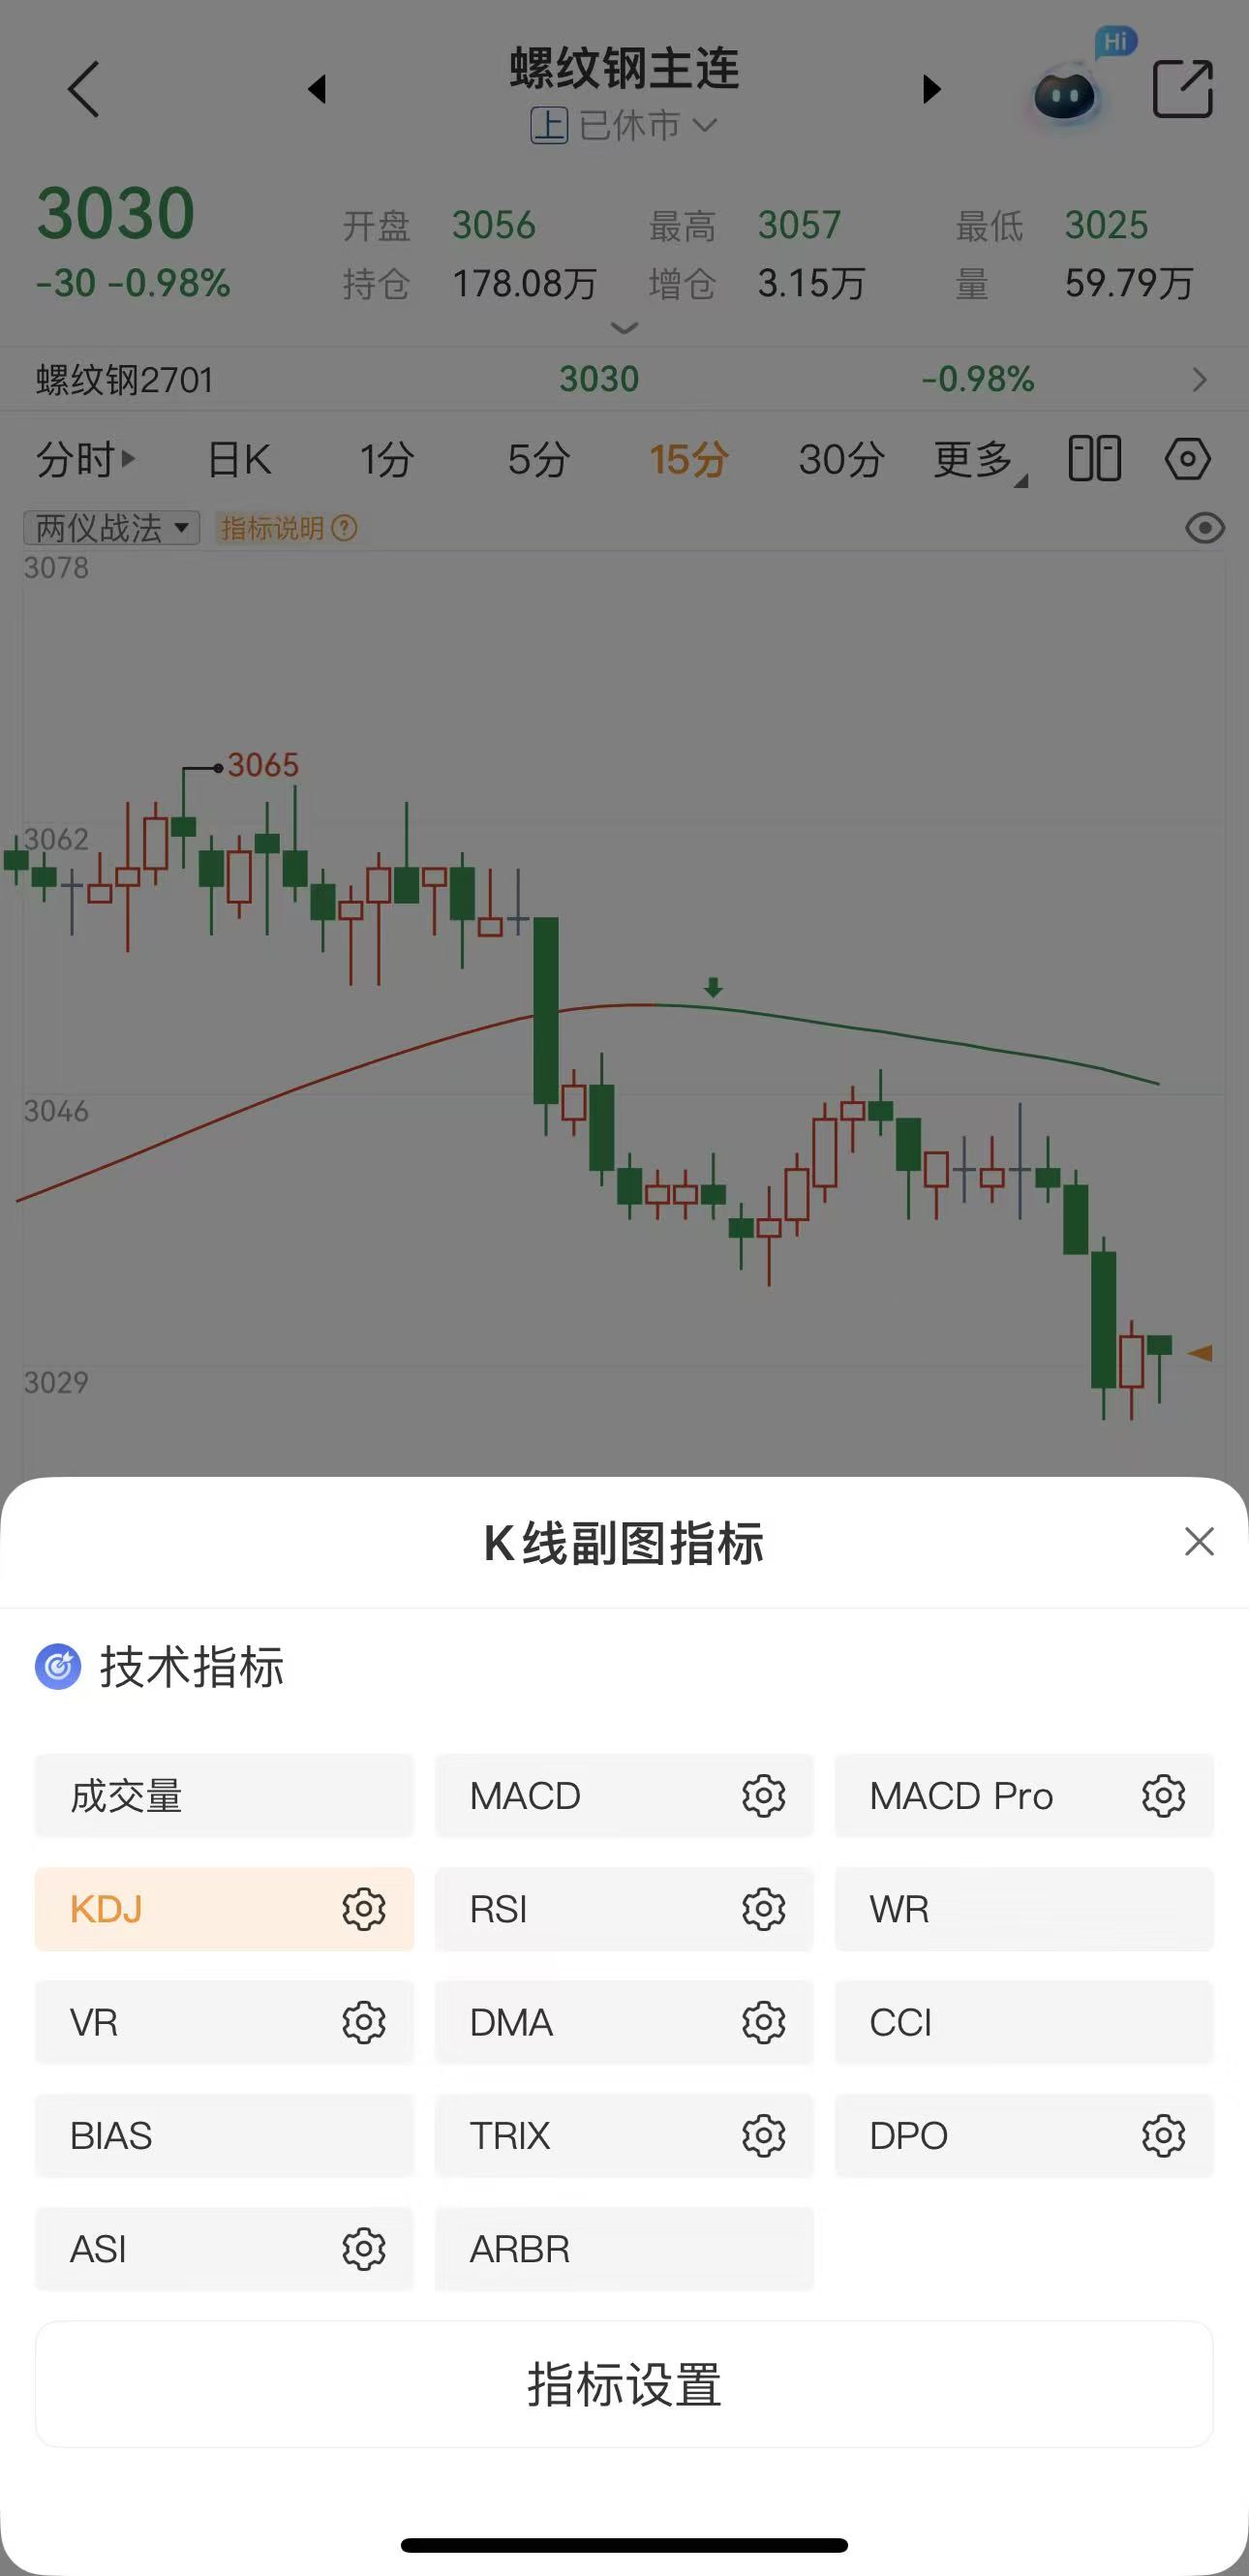
And even more so, you can use kdj and mcd at the same time, and a set of classic tactics can be used directly on the phone, without switching back and forth on different pages. The movement of the k line, the indicator pattern, the sum of the barter are presented on the screen, and the information is clear and can be found at the first moment when the gold fork appears。
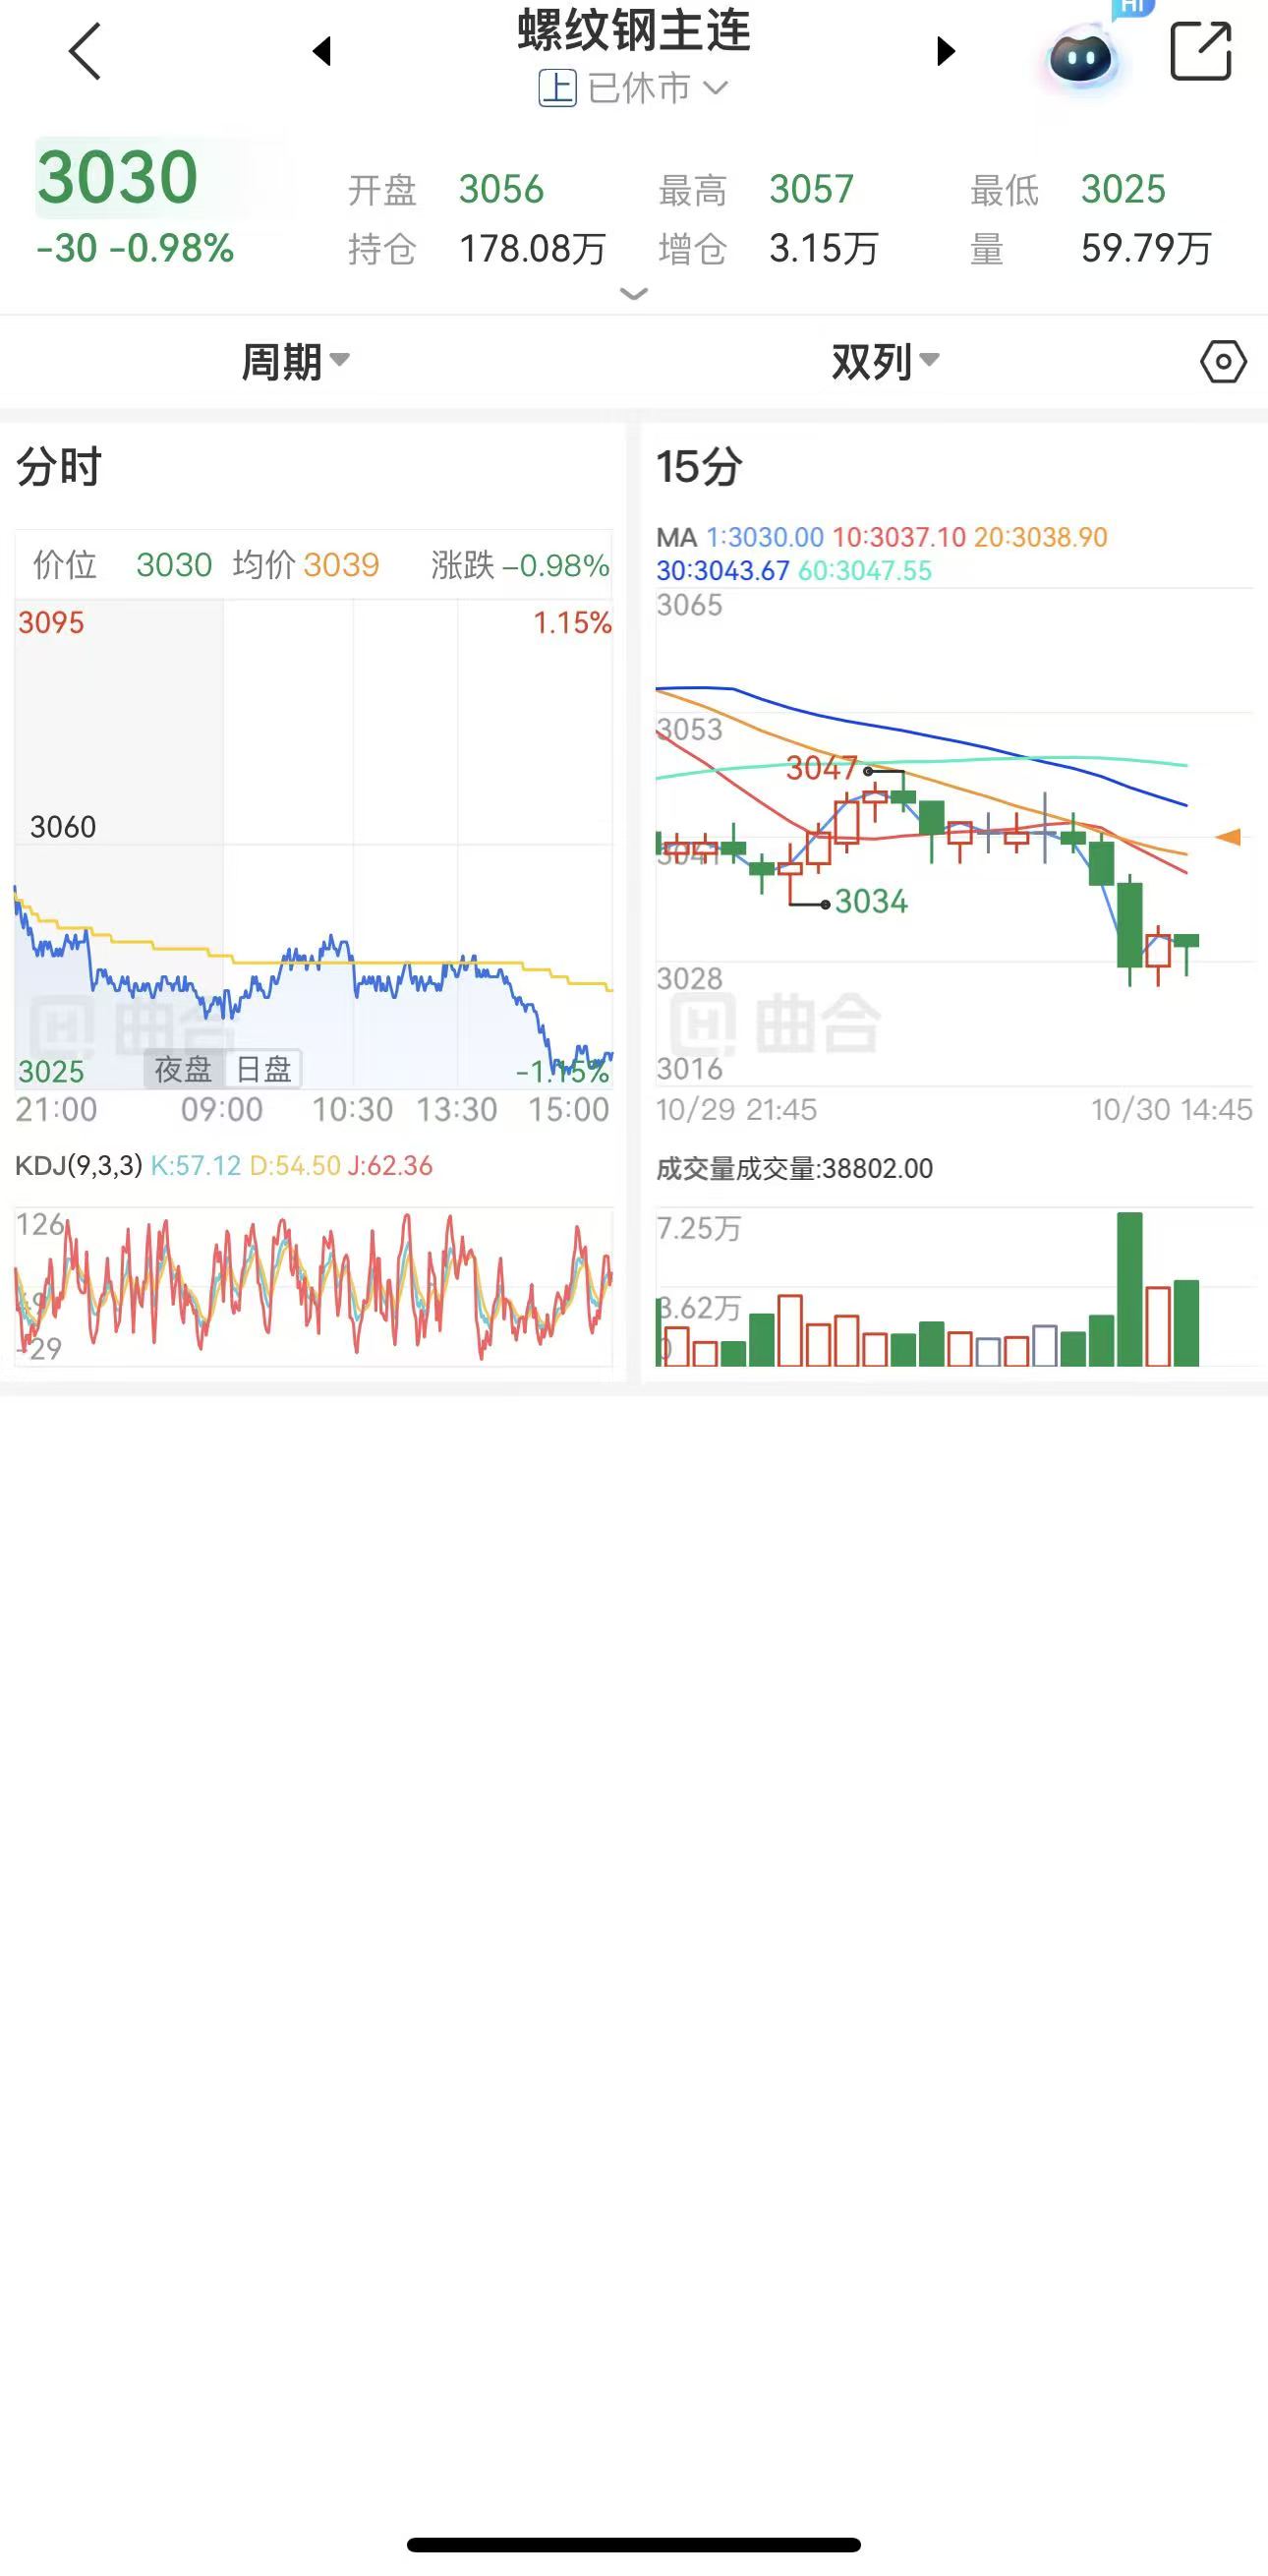
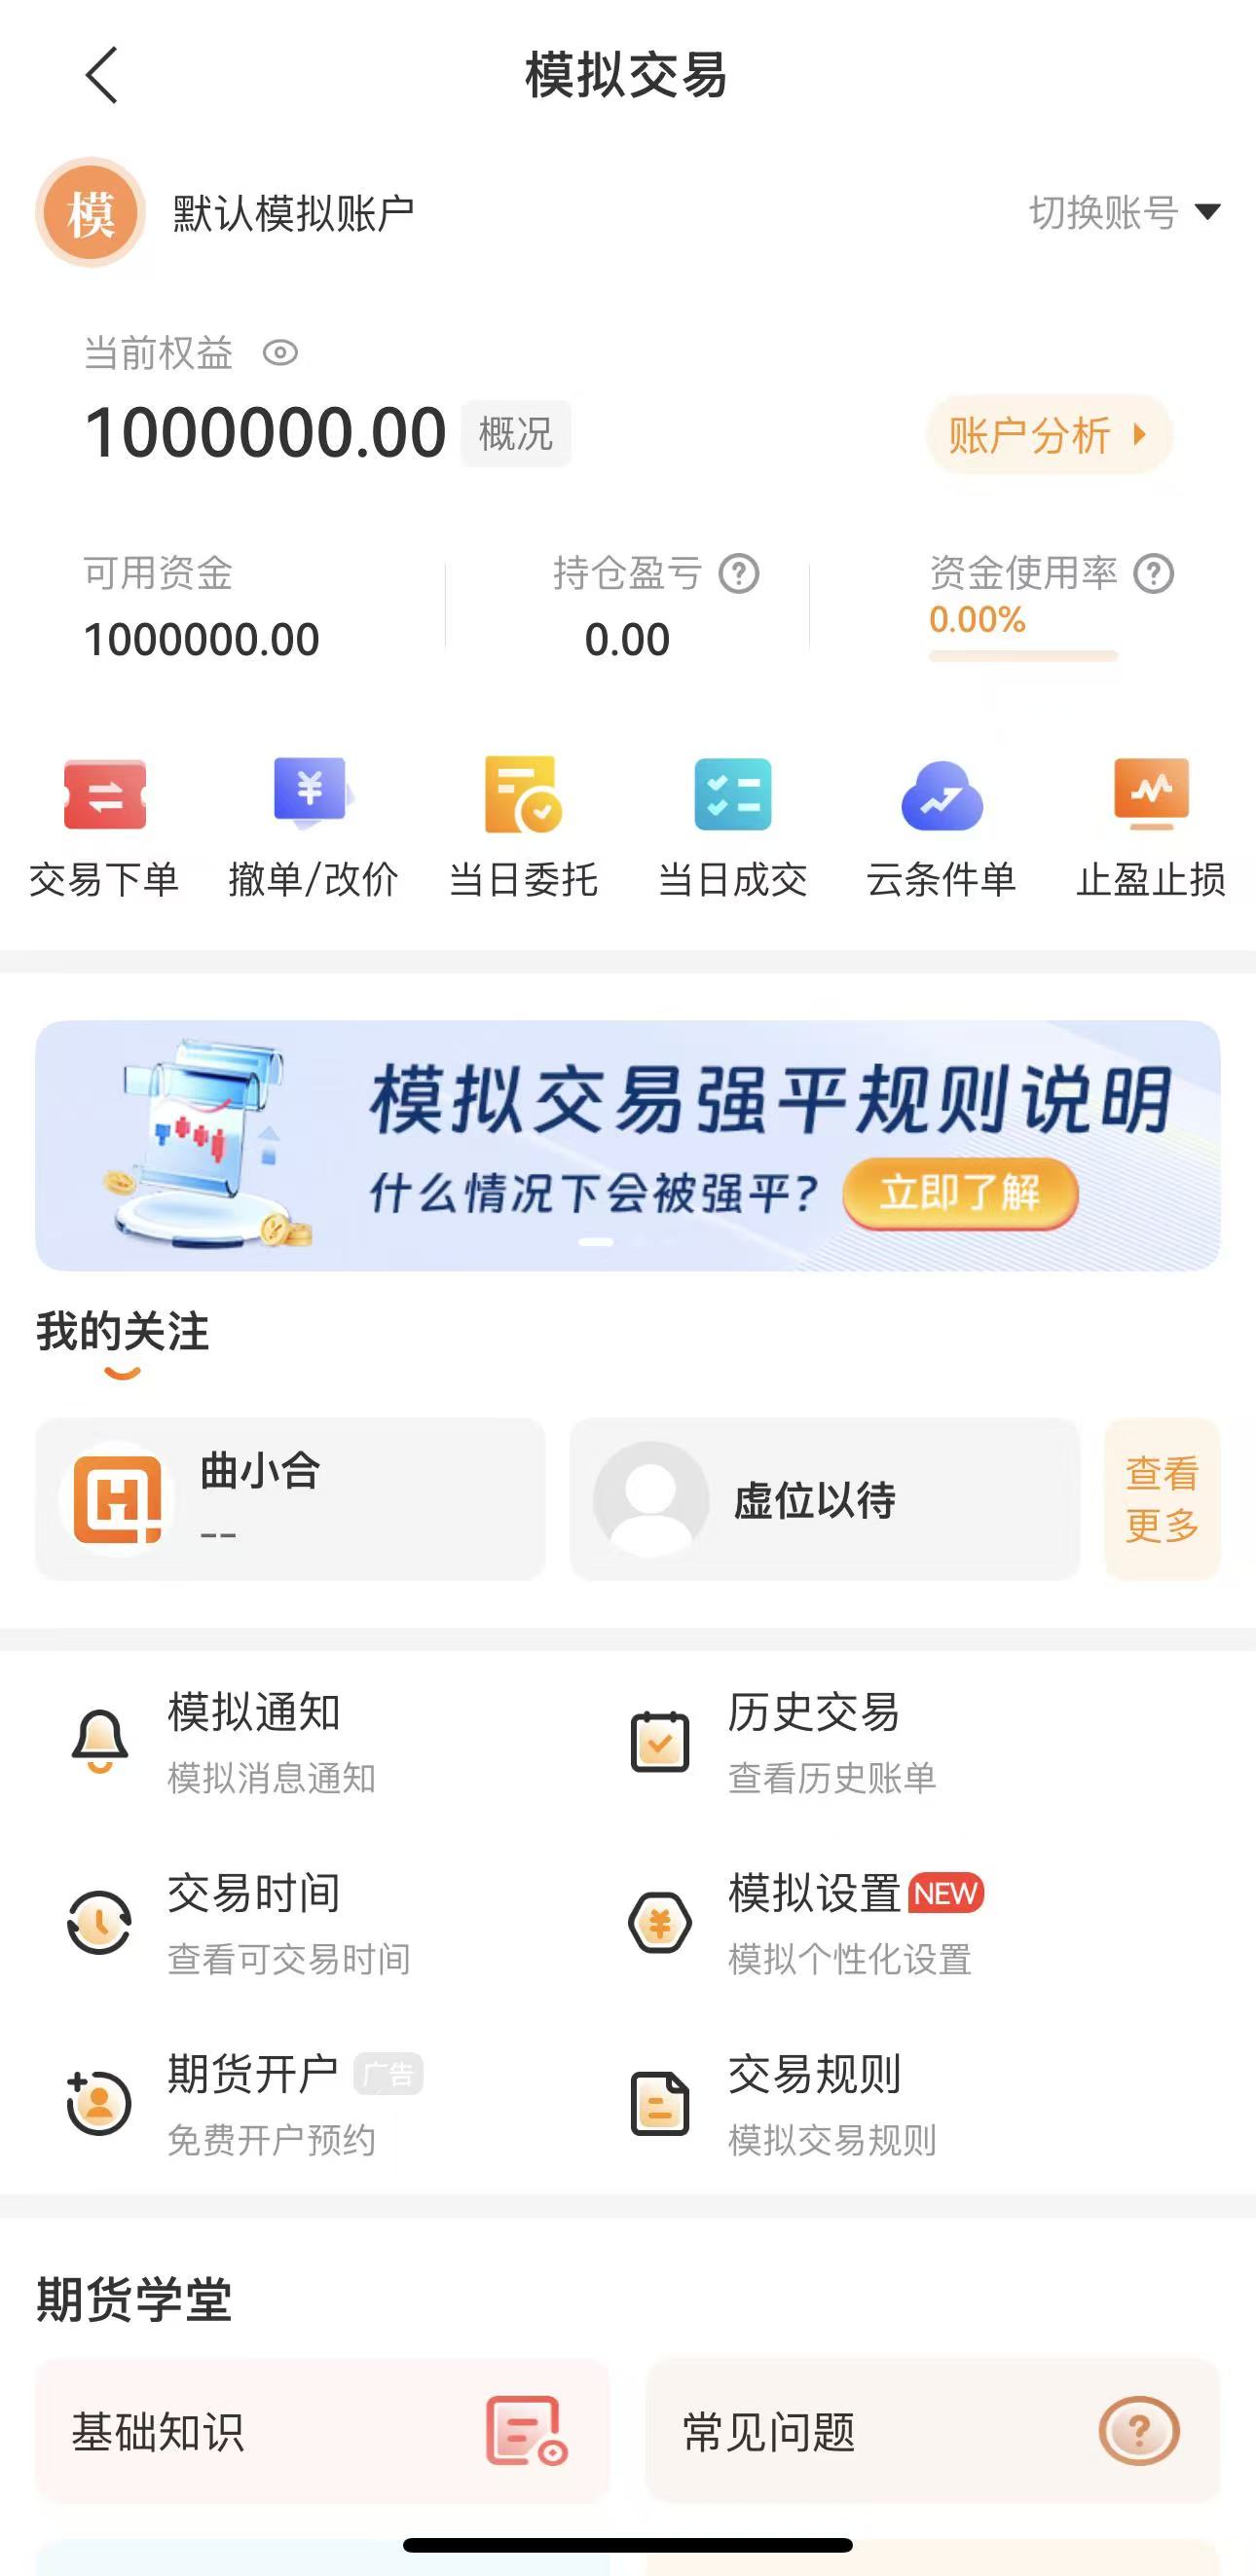
For start-up friends, the concocting app also provides a complete analogue trading environment, and all indicators such as kdj are fully aligned with the actual disk, so that kdj's various usages can be refined first with simulation gold and then put on the actual disk at almost zero error costs。
Kdj is a very practical short-line tool, but it's not a universal key. Understanding its principles, disaggregating the quality of the signal, and combining it with a smooth disk software can truly be of value. If you want to use kdj freely on your mobile phone for futures analysis, you might want to download it to fit the app experience, and professional indicator functionality, along with full line data, will go a long way。
This content is generated by ai-assisted manual verification。