

Three python methods of comparing the two time series to the same graphic sharing
Update: 23/03/03 08:53:03 by python practical monument
This article provides you with three methods of comparing the two time series in python with a graphic similarity. Down
Compares the graphic similarity of the two time series by:
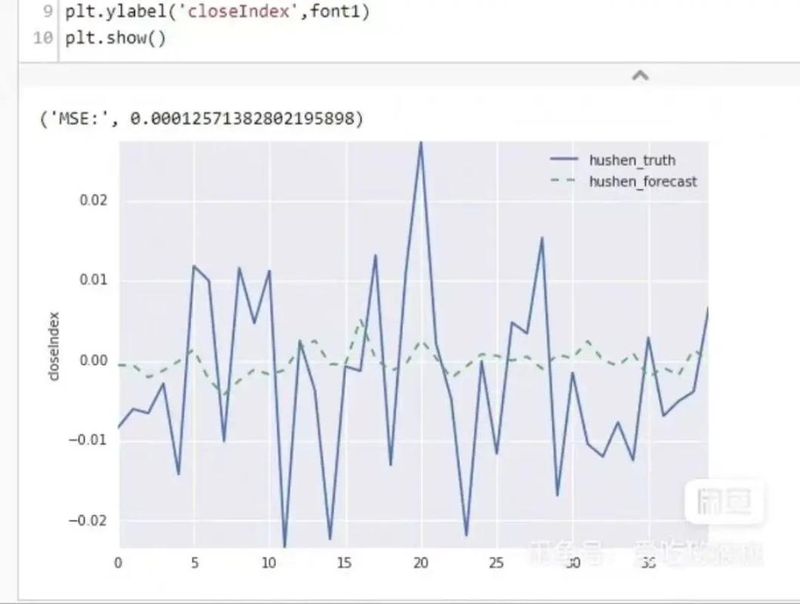
Visual comparison: two time series are drawn on the same map and compared using the same scale and axis labels. They can be compared by observing characteristics such as trends, peaks and valleys。
3. Comparison of peaks and valleys: comparison by comparison of peaks and valleys in two time series. Their magnitude and location can be compared。
3. Relevance analysis: calculate relevant coefficients between time series to determine whether they have linear relationships. If their relevant coefficients are close to 1, their trends are similar。
Non-linear approach: a non-linear approach is used to compare two time series, such as dynamic time scheduling, small wave change, etc. These methods help capture similarities between the two time series。
It should be noted that similarity on graphics does not fully represent a similarity between the two time series, as the same graphic can correspond to different time series. Therefore, a combination of multiple information needs to be considered in the time series comparison。
1. Preparation
Before you start, make sure that python and pip are installed successfully on the computer, and if not, you can access the article: super-detailed python installation guide for installation。
If you use python for data analysis, you can install anaconda directly, which contains python and pip.
In addition, it is recommended that you use the vscode editor, which has many advantages
Please select either of the following ways to enter the command installation dependency:
Windows environment opens cmd (start-run-cmd)。
Macos environment open terminal (command+space input)。
If you're using a vscode editor or pycharm, you can use terminal directly below the interface.
Pip install matplotlib
pip install numpy
2. Comparison of two time series using matplotlib visualization
II'm sorry, mate.
# generate time series data
x = [1, 2, 3, 4, 5]
y1 = [10, 15, 13, 17, 20]
y2 = [8, 12, 14, 18, 22]
# draw a two-time line figure
plt. Plot(x, y1, label='y1')
plt. Plot(x, y2, label='y2')
# set graphic properties
plt. Xlabel ('time')
plt. Ylabel
plt. Itle. Plt. Legend()
# show graphics
plt. Show()
2. Factors relevant to the calculation of two time series
II'm sorry.
# generate time series data
x = [1, 2, 3, 4, 5]
y1 = [10, 15, 13, 17, 20]
y2 = [8, 12, 14, 18, 22]
# calculate relevant coefficients
corr = np. Corrcoef(y1, y2) [0, 1]
# output result
("correction coefficient: ', corr)
3. Use of python to achieve dynamic time adjustment algorithms (dtw)
II'm sorry.
# generate time series data
x = [1, 2, 3, 4, 5]
y1 = [10, 15, 13, 17, 20]
y2 = [8, 12, 14, 18, 22]
# dynamic time adjustment algorithm
df dtw disarmament (ts a, ts b, d=lambda x, y:abs(x-y)):
dttw =}
# initializing border conditions
for i in range (len(ts a):
dttw [(i, -1)] = float('inf')
for i in range (len(ts b):
dtw [(-1, i)] = float('inf')
dtw [(1, 1)] = 0
# compute the dtw matrix
for i in range (len(ts a):
for j in range (len(ts b):
cost = d (ts a[i], ts b[j])
dtw [(i, j)] = cost + min (dtw [(i-1, j)], dtw [(i, j-1)], dtw [(i-1, j-1)])
# return to dtw distance
return dttw [len(ts a)-1, llen(ts b)-1]
# calculating the dtw distance between two time series
dtw dislist =dtw distance(y1, y2)
# output result
right
This is where the article about three pythons sharing methods for comparing the two time series to the same graphics, and more about python comparing the time-series graphics to the same content. Please search for previous script home articles or continue to look at the following articles and ask for more support for the script house later