

In the a stock market, the mcd indicator is an important technical indicator for stock price forecasting, and the mcd classic is not just a bottom-up choice, but also the best point of sale to capture a strong rise. The following is a detailed presentation of the mcd indicators:
The importance of the macd indicators is demonstrated by:
(1) macd indicators are the default preferred indicators for major stocks and futures applications。
(2) the mcd indicators are, of course, the most used and the most effective and practical indicators ever tested。
(3) the macd indicator is an oscillation indicator calculated by the ema of the trend class, which is well applied to trends and shocks。
(4) the deviation from the macd indicator is considered to be one of the best techniques for “detaching from the top”。
(5) the macd indicator is the preferred entry indicator, the starting point for many investors to enter the indicator study, and the ultimate indicator that many people are still using after having come to terms with other indicators, even after having created them or used a combination of them. The so-called “people looked for her thousands of times and looked back and the man was in the fire”
(6) the mcd indicator is one of the most common entry and exit grounds for systematic traders and is widely used to determine where to buy and sell and how empty the market is。
Macd basic analysis:
1. Scope of application
First, mcd is an indicator, following this argument i, a supporting tool and not a basis for decision-making。
Second, this indicator should be used primarily for index analysis。
Thirdly, this indicator is in the medium term。
2. The three regions of mcd
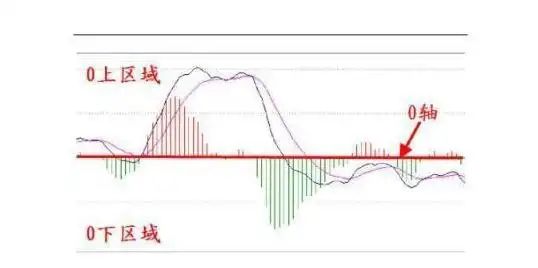
The macd indicators can be divided into three regions: 0-axis, 0-top, 0-low, and, in general, the medium-term upward trend indicator, 0-high, and the medium-term downward trend, 0-low, can be used to validate the performance of the trend。
3. Technical parameters for graphical mcd
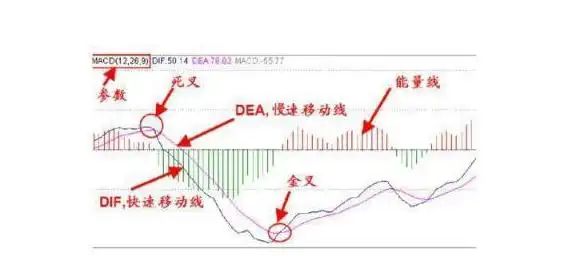
A. Parameters, general default (12, 26, 9), which can be adapted to experience and personal habits and represent the periodicity。
B, dif and dea, respectively, represent slow and fast moving lines。
C, gold fork and dead fork, dif in gold fork, dif in dead fork, dif in dead fork. Many people are caught in the wrong spot where gold fork buys and dead fork sells. In fact, indicators need to be combined with trend analysis. Step
For example, while the dead fork in the middle of the upward trend tends to be bought and sold at the end of the upward trend, the gold fork in the middle of the downward trend is sold and at the end buy。
D. Energy lines, in general, represent the strength and weakness of a trend。
The basic principles that should guide the use of mcd indicators are:
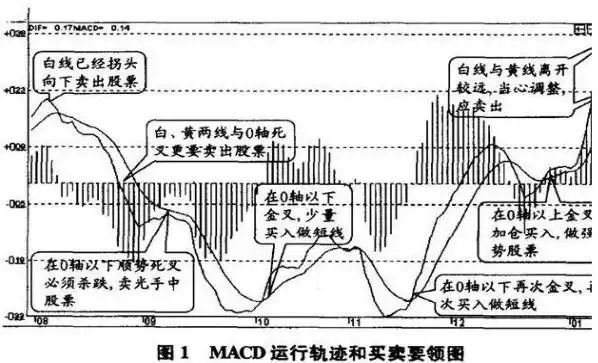
(1) when dif and dea are above 0 axis, they belong to multiple markets, and the dif lines are bought from the bottom up through the dea line. When the dif line crosses the dea line from the top down, if the two values are still in the 0-axis or above, it can only be regarded as a short fall, and it cannot be determined whether the trend has turned, at which point the sale needs to be judged by other indicators;
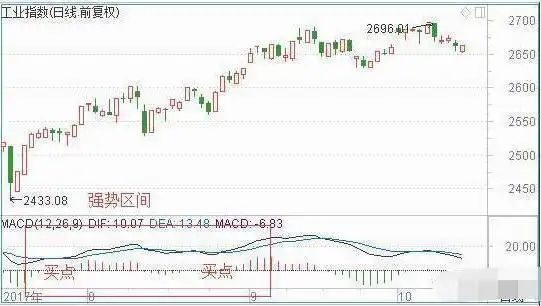
(2) when dif and dea are below the 0 axis, they belong to the empty market. When dif lines cross the dea line from top to bottom, they sell signals, and when dif lines cross the dea line from bottom to bottom, if the two values are still below the 0-axis, they are considered only as a short rebound, not as a definitive reversal of the trend, at a time when sufficient buy-in requires a combination of other indicators。
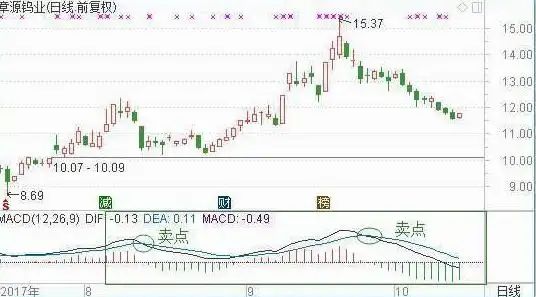
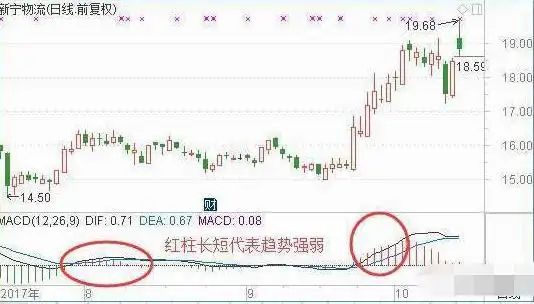
(3) cylinder constriction and amplification. In general, the continued contraction of the column line indicates that the intensity of the trend is gradually diminishing and the trend is determined to turn when the column line colour changes. This view, however, is not fully valid in the context of the use of some of the non-cyclical mcd indicators。
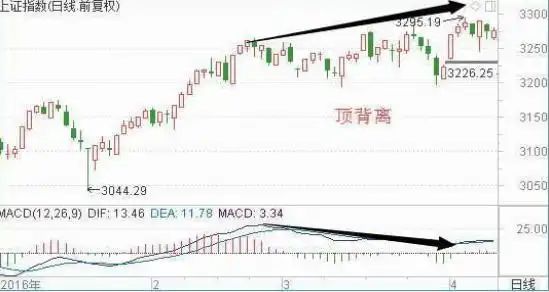
(4) form and deviation. Macd indicators also emphasize patterns and deviations. (a) be vigilant when the dif line and the mcd indicator form a high viewing drop, such as the top of the head shoulder, double head, etc.; the purchase should be considered when the morphological mcd indicator dif line and the mcd line form a low viewing up pattern。
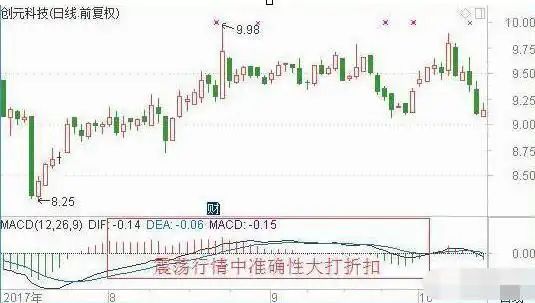
(5) indicators in the cattle hide market will be distorted. When prices do not run top-down or bottom-up, but rather keep moving in a horizontal direction, we call it the bullskin market, where false signals will be generated in the mcd indicator, where the dif line and the mcd line will cross very frequently, and where the column line will be frequented and the colour will often turn from green to red or red to green, when the mcd indicator is defunct and the value of its use decreases accordingly。
Mcd gold fork, dead fork
This is one of the most common forms in the macd, and it should be understood that the white line is a golden fork and a dead fork. The equity fork indicates that prices have risen and that short-term inflows have outpaced long-term inflows, so that at this point in time there is a greater chance of profit in the long run。
If the yellow-white line is operating below the zero axis for a period of time and is further away from the zero axis, it means that the price has declined over time, at a time when the white line is on its head, penetrating the yellow line, at a time when the price has shown a bottom sign and the willingness to invest is generally a point of a long line。
If the yellow-white line is entangled in the vicinity of the zero axis for a long time, this means that the main force is here to suck, wash, and at this point there is a gold fork, which is likely to end。
When the yellow and white line runs directly above the zero axis at a distance below the zero axis, the gold fork appears again near the zero axis, which is called air refuelling。
Fork, look up; shock, look up; fork, look up; fork, look down; fork, look down; fork, look up; fork, look up; fork, look up; fork, look up; fork, look down。
Mcd application: around "dispersion", here is the main discussion on the macd indicator pole。
Four typical poles: head bumps, kicksticks, how much to kill, emptiness. Great
1 the abbreviation bar appears, indicating that the distance difference between dif and dea will be smaller, and the distance difference between the 12 and 26 day averages will be smaller, and the k line will fall or fold. The abbreviation bar is synchronized with the k-line or rotated。
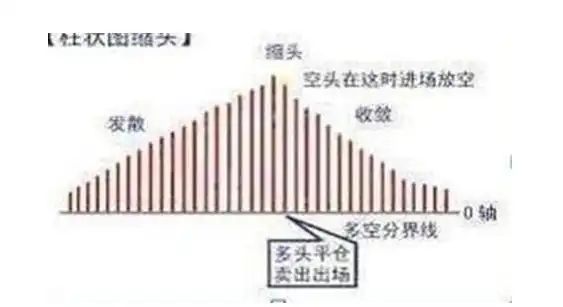
Scratch rods: this shows that the distance difference between dif and dea will be smaller, and the distance difference between the 12 and 26 day averages will be smaller and the k line will rise or be plated. Scratch rods are synchronized with k-lines or rotated。
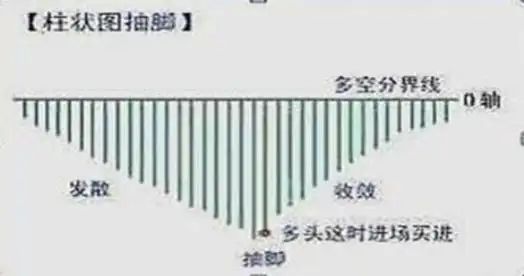
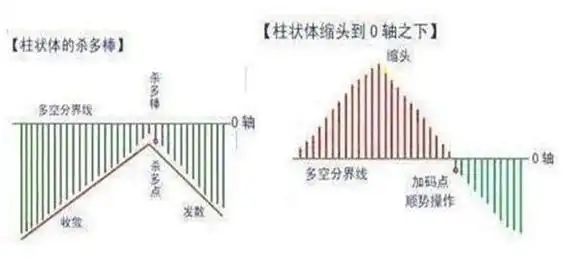
3 kill how great it is: killing how great it is, means that the distance difference between dif and dea is going to get bigger, so that the distance difference between the 12 and 26 days average line is going to get bigger and the k line is going to fall. The k-line is being synchronized with the killing。
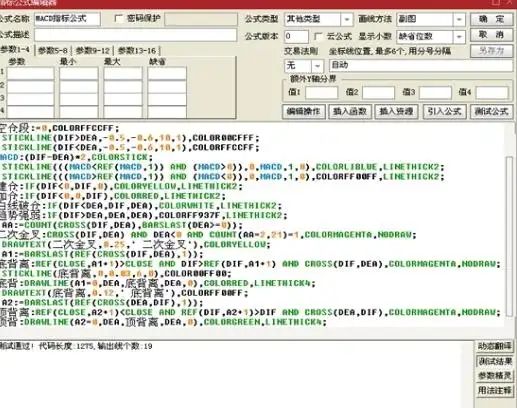
Buffalo macd 2 fork source formula test
Dif: ema (close, 12)-ema (close, 27), colorred, linethick2;
Dea: ema(dif, 9), colorwhite, linethick2;
(b) hold segments: = 0, color00cfff;
Air silo segment: = 0, colorffccff;
Stickline(dif>dea, -0. 5, -0. 6,10,1), color00cfff;
Stickline
Macd (dif-dea)*2, colorstick;
Stickline(((macd0), 0, macd, 1. 0), cololiblue, linethick2;
Stickline(((macd>ref(macd, 1)))
Construction: if(dif)
Garment: if(dif)
White line brush: if(dif)
Trends are strong: if (dif>dea, dea), colorff937f, linethick2;
Aa: =count (cross (dif, dea), barslast (dea > 0));
Second golden fork: coss (dif, dea) and dea
Drawtext (second gold fork, 0. 25, 'second gold fork'), coloryellow;
A1:=barslast (ref (cross(dif, dea), 1);
Bottom deviation: >close and dif>ref (dif, a1+1) and colormagenta, nodraw;
Stickline (deviation, 0,0. 03, 6, 0), color00ff00;
Bottom: drawline (a1 = 0, dea, 0), colorred, liethick4;
(a) drawtext (bed deviation, 0. 12, 'bed deviation'), colorff00ff;
A2: =barslast (ref(dea, dif, 1));
I'd like to introduce you to the mcd
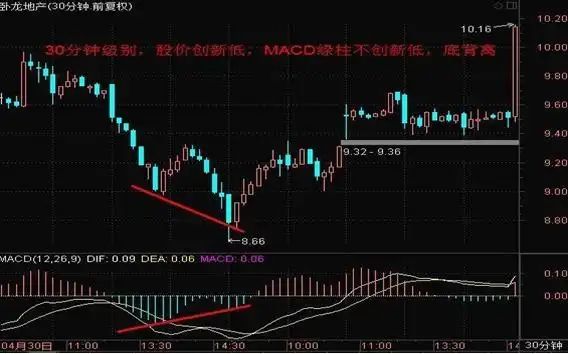
1. Macd wolf protection - (cow stock scrambling!)
According to quakers, the macd yellow and white line, which runs above the 0 axis, belongs to the operational area. When shareholders choose shares, they need to circumvent the yellow-white line below the 0-axis。
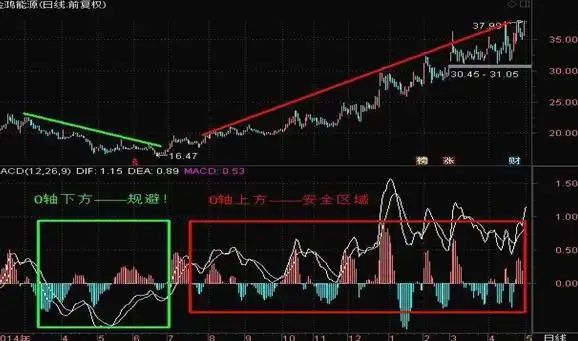
Two, macd bottom deviation -
The new low stock price phase and the new low of the macd green column fall short of the macd bottom deviation。
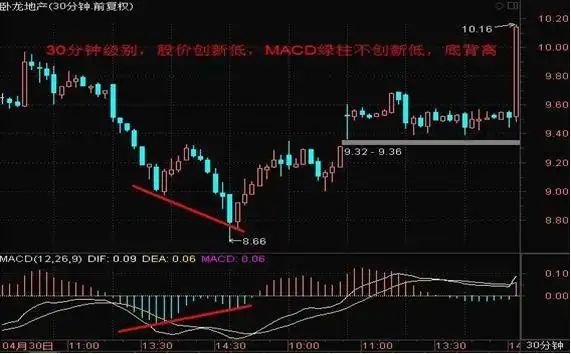
3. Macd top deviations - (cow market mcd top deviations are poor and not recommended. But in bear city and stun city, the mcd top deviation is good, it's important to sell the signal
The new highs in stock prices and the new highs in the macd green column are at the top of the macd。
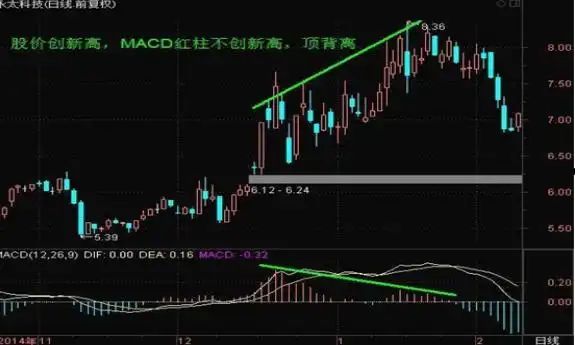
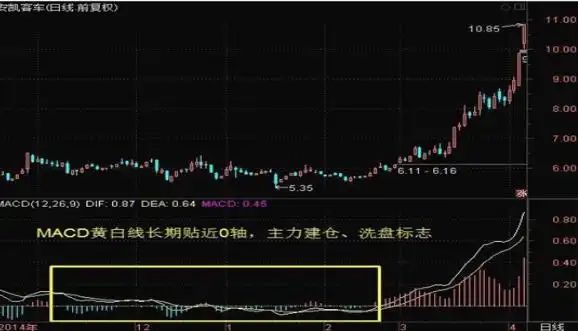
4. Macd yellow and white line 0-axis long flow - (macd yellow and white line has been running close to 0-axis for a long time. It is a performance of primary inhaling, dishwashing, where investors encounter such stocks and focus on them!)
The mcd yellow and white line has been running close to the 0-axis for a long time, and once it spreads upwards, the stock price explodes upwards!
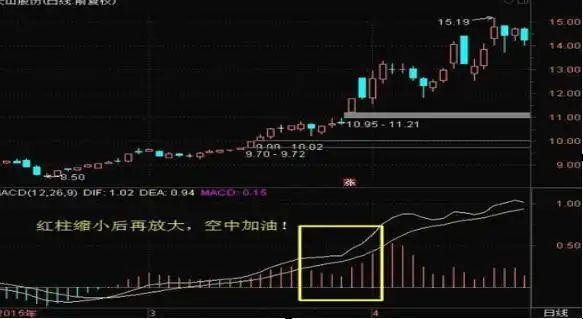
5 mcd air refuelling - (macd air refuelling is common in cattle, usually rising when it happens!)
In the rising trend of stock prices, the macd has a red column. After the stock price was adjusted, the macd red column was reduced. But then the stock price went up and magnified the mcd's red column, while mcd refuelled in the air and continued to see it rise!
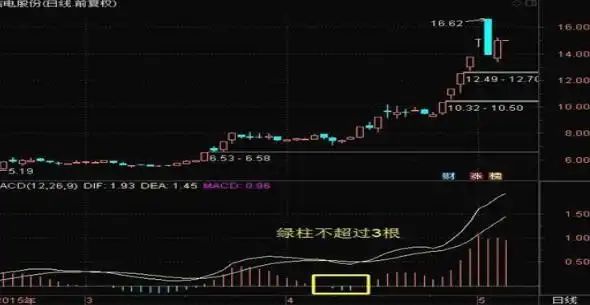
Six, mcd three greens - (macd greens not good, but less than three o'clock greens, re-attacks, red pillars, strong ones!)
After an upward trend in stock prices was maintained, adjustments were made, but the macd green column showed less than three green columns, and the stock price continued to rise!
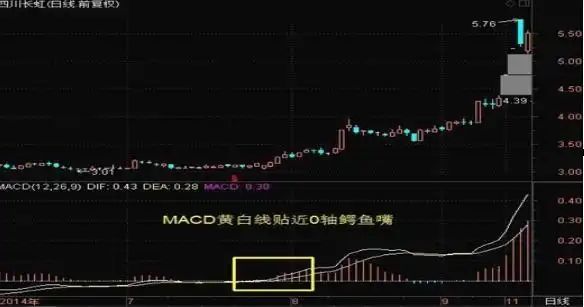
7 , mcd crocodile mouss -- (many of the cow stock starters are mcd crocodile mouths, which can also be applied in 30 minutes)
The mcd yellow and white line shows the gator mouth form near the 0-axis!
The first gold fork above the 0-axis of the mcd yellow white line - the highest accuracy of the 1-fork above the 0-axis
The mcd yellow and white line's first gold fork above the 0-axis is a buy-in!
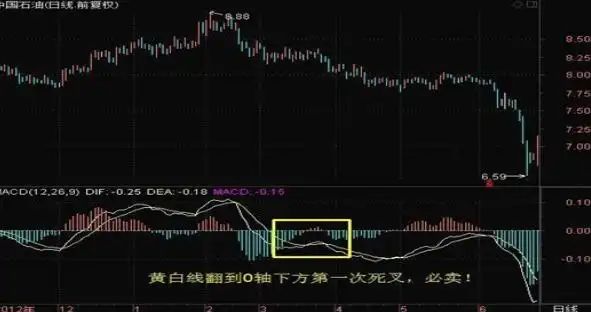
9 and the first fork below the 0-axis of the macd yellow and white line - (first fork below the 0-axis, stockholders must remove their shares)
The mcd yellow and white line must be sold for the first time below the 0-axis!
In this downward trend, can we use mad to capture the gap?
1) there must be a large level of mcd back-drive (daily or 30 minutes) and the method of dealing with it is to see the second level of mcd back-drive (infinite reading, accurate to timescale);
2) the timing of the sale is when the top of the first class (30 minutes or 5 minutes) appears, and the method is to sell the second level of the mcd when it is about to be formed (infinite reading, precise time map);
3) the use of 1f time chronograms of mad for unlimited wave-band operations to reach a 50 per cent (threshold) turnover rate for stock holdings;
(4) the above-mentioned statement is that the small funds are fully settled in one place or that the above-mentioned method is applied in a smooth manner. In theory, you can do 200 shares。
5) macd has a yellow and white line, which is sold when it touches the o-axis in a downward trend; it is bought in an upward trend;
6) when the deviation rate is greater, the more likely the operation is, the more accurate it is and the more accurate the time map is;
Operations are similar in the upward trend, with the difference between looking at the next level at the time of purchase and looking at the next level at the time of sale。