

Today i would like to talk to you about a word that is often heard in the stock market: chips. To be honest, when i first came across the stock, it was a misty word. It sounds like something in a casino. How does it get involved in investment? It took me a lot of time to figure it out。
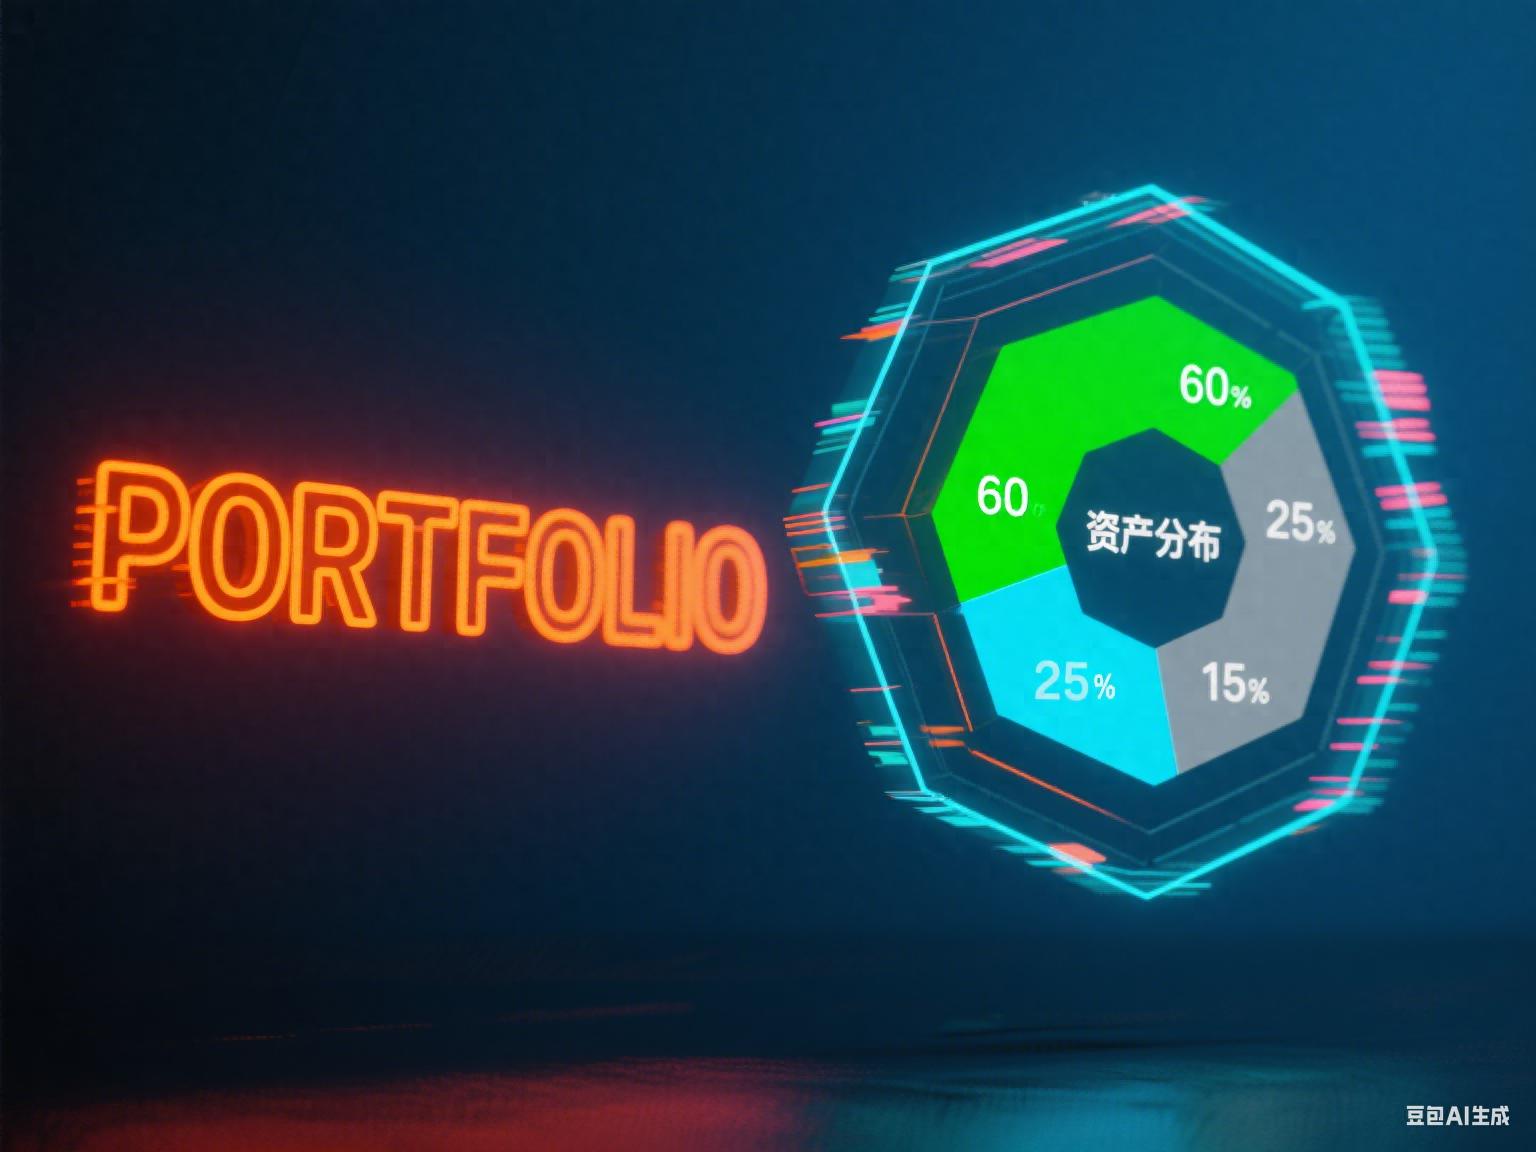
Let's get rid of those complicated definitions. In short, in the stock market, the chips point to the stock itself. The stock you hold is your chips in this market. It makes sense that it represents one of your rights as a shareholder. But it's more than that。
It also has a deeper meaning. The leverage also refers to the amount of stock available for trading in the market. That's an interesting angle, looking at stocks as a tool for exchange and games. Market participants buy and sell these tools, and prices fluctuate in the process. Understanding the chips is, therefore, a key entry point to understanding the game。
So, what are we, ordinary investors, working on chips? My own experience is that the core is to see whose hands these stocks are concentrated. Is it scattered in the hands of countless families, or is it locked in by a few large sums of money? Different distribution patterns tend to signal different future trends in equity prices。
Here is an important analysis:Cobalt distributionI don't know. You can imagine it as a mountain profile, with different heights representing different stock prices, while the height of the mountain represents the amount of stock accumulated at that price. By looking at this, you can visualize the average holding cost of the market。
When i started studying this map, i felt too much information. Later, i found that it was crucial to capture several priority areas. One is the profit margin area, the part where the current equity price is higher than the average cost. The other is a caged area, which is the opposite. The thin changes in the two regions often reveal the loss of much empty power。
In short, static distribution alone is not enough. The chips are moving, it's moving. I am particularly concerned with the process of shifting leverage from fragmentation to concentration, or from concentration to fragmentation. When chips are exchanged repeatedly within a given price range and eventually become highly concentrated, it often means that trends are likely to change more clearly. This observation helped me a lot。
Of course, leverage analysis is not used in isolation. I usually combine it with technical prices and turnover. For example, when stock prices break through an important position of resistance, if accompanied by a significant easing and shift of leverage in that position, the effectiveness of such a breakthrough will add much to my mind. It's better than just looking at a k-line。
Speaking of which, you may find it too difficult to analyze these things. It is true that the workload is enormous and susceptible to subjective emotions, based solely on manual rediscovery, statistics and drawings. I myself have gone through this phase, often feeling overwhelmed and unable to process information, let alone judge precisely。
Later, i had access to a number of tools, which improved the situation. For example, i'm going to use the treasure treasure to complement my analysis. It has an ai trend intelligence that helps me quickly to judge whether a stock is on the rise, shaking or falling trend, which gives me a clearer idea of the broader context in which the chips are shifting, so i don't have to do a little bit of k-line myself。
It's also very practical. I can see whether the general mood of the market for a particular stock is more or less, and the mood shift. It's the equivalent of another dimension, helping me verify the market mentality reflected in the distribution of chips. Sometimes the chips show a concentration, but if suddenly it turns negative, then i have to be more careful。
For selected units, the ai selection function within it also provides thought. I can set up strategies, like looking for stocks that are upwards and market-oriented, and the system filters automatically. This has helped me to narrow the scope of observation, and i have been able to focus more on the analysis of the chips that were the subject of these initial screenings, which has improved considerably。
In my view, for our ordinary shareholders, the value of tools is to free us from cumbersome information processing and to focus more on decision-making itself. The average cost of the next day for a tool like this is not high, but the time savings and clarity of thinking are, i think, worth it. If you're interested, you can go through the hefty treasure wisdom applet and experience it first, or you can focus on hefienet's public domain, and they'll send some key market interpretations。
Let's get back to the subject of leverage. Ultimately, it is the cost and mindset of the other players in the market that is studying the chips. It can't tell you whether the stock price will increase or fall tomorrow, but it can help you assess where the current risks and opportunities are. It makes your understanding of the market, from a two-dimensional price map, more solid。
For me, the biggest change in the analysis of the chips is in the mindset. I am no longer so easily confused by short-term booms and drops that i understand some of the game logic behind price fluctuations. Although it is only one of the tools in my decision-making toolbox, it is indeed a very sophisticated tool。
I'd like to conclude by saying that the stock market doesn't have a master key. The analysis of the chips has both value and limitations. For example, it is unable to predict sudden macro-changes or to see fully the true intentions of capital. What we need to do is to continue to learn, to integrate a variety of analytical approaches and to form our own system of judgement. There is no shortcut, but every step is counted。